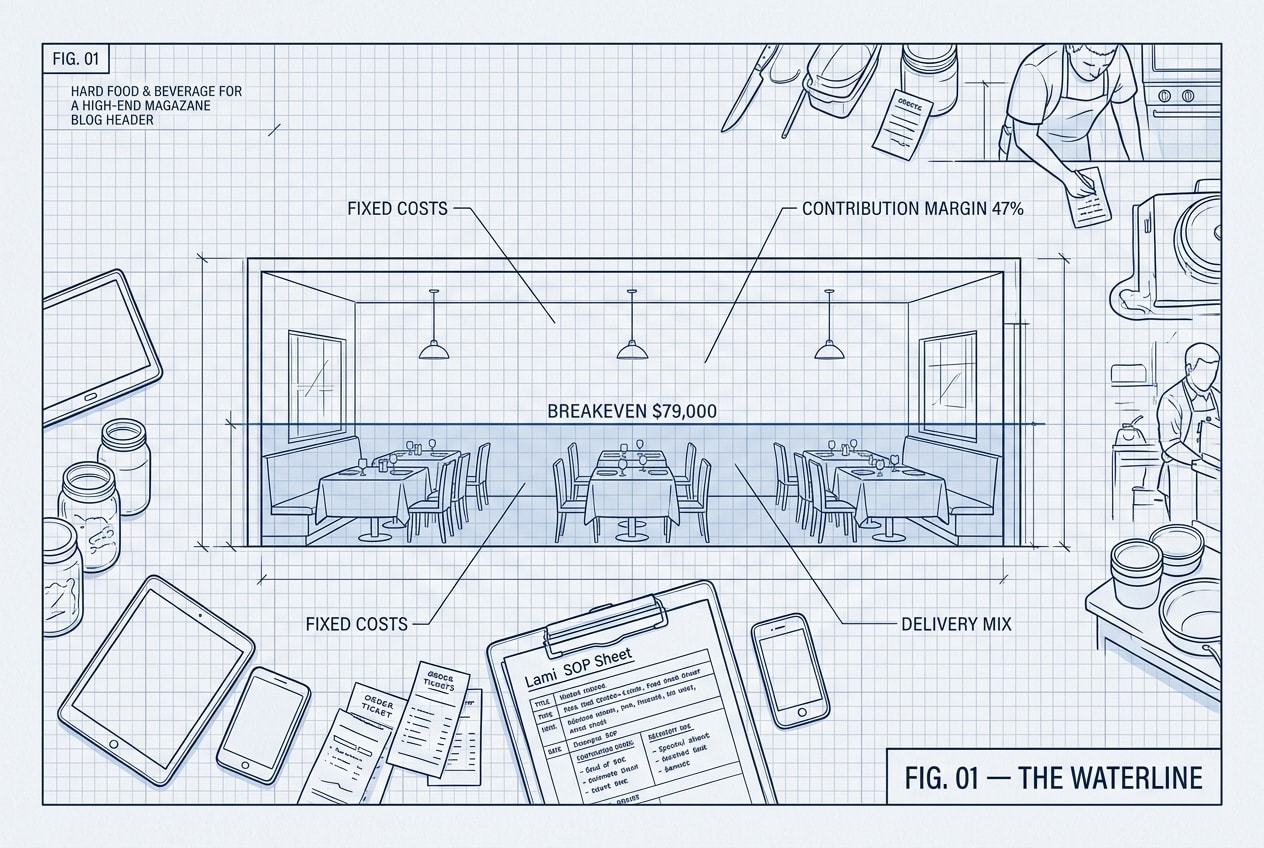
Restaurant Breakeven Sales Formula: What Each Outlet Has to Do to Cover Itself
7 min read
Your outlet did $92,000 last month and lost money. What number would have been enough?
Most operators can't answer that within ten thousand dollars, which is a strange thing to be vague about. It's one of the few numbers in F&B that's genuinely knowable in advance, it doesn't require a stocktake or a POS integration to calculate, and once you have it, half the hard decisions in the business get easier — whether to keep Monday lunch open, whether the promotion is worth running, whether the new site's rent is survivable.
The restaurant breakeven sales formula is one line:
Breakeven sales = Fixed costs ÷ Contribution margin ratio
The formula is trivial. Getting honest inputs is the work.
Step 1: Split your costs into variable and fixed — honestly
A variable cost moves with every dollar of sales. A fixed cost turns up whether you sell anything or not. Most F&B P&Ls have a handful of lines that people classify by habit rather than by behaviour, and each one of those quietly shifts your breakeven.
Variable, in almost every operation:
- Cost of goods sold
- Delivery platform commission
- Delivery platform promotion spend
- Card payment (MDR) fees
- Packaging and takeaway consumables
- Hourly and part-time wages, to the extent you actually flex them
Fixed, in almost every operation:
- Base rent, service charge
- Salaried payroll — chefs, managers, head office recharges
- Insurance, licences, software subscriptions
- Depreciation on the fit-out
- Interest
The ones that catch people out:
- Turnover rent. If your lease charges a percentage of gross turnover above a threshold, that portion is variable. Malls in this region write these leases routinely, and treating the whole rent line as fixed will overstate your breakeven.
- Hourly labour. Only variable if you genuinely cut shifts in a slow week. If the roster is the same in February as it is in December, it's behaving like a fixed cost, and your model should say so.
- Utilities. Partly variable, mostly not. Treating it as fixed is close enough unless you're running a very seasonal operation.
Step 2: Work out your contribution margin ratio
Contribution margin is what's left from each dollar of sales after the costs that dollar caused. As a ratio:
Contribution margin ratio = (Sales − Variable costs) ÷ Sales
Take the outlet from our consolidated group P&L — $100,000 in monthly sales, 38% of it through delivery:
| Variable cost | Month |
|---|---|
| Cost of goods sold | 30,000 |
| Delivery platform commission (28% of delivery sales) | 10,640 |
| Delivery promotion spend | 1,000 |
| Card payment fees | 900 |
| Packaging and consumables | 1,500 |
| Hourly wages | 9,000 |
| Total variable | 53,040 |
Contribution = $100,000 − $53,040 = $46,960, so the contribution margin ratio is 47.0%. Forty-seven cents of every sales dollar is available to cover the costs that don't care whether anyone walks in.
Now the fixed side: rent 12,000, salaried payroll 17,000, staff-related 3,000, brand marketing 1,500, other fixed operating 3,600. Total fixed operating costs: $37,100.
Step 3: Divide
$37,100 ÷ 0.470 = $79,000
At $79,000 of sales, this outlet covers every cost down to EBITDA. Below that it's consuming cash to stay open. The venue did $100,000, so it cleared breakeven by $21,000 — and at a 47% contribution margin, that surplus dropped $9,860 to EBITDA.
That relationship is the useful part. Every dollar above breakeven is worth 47 cents. Every dollar below it costs you 47 cents. A quiet week that comes in $8,000 light doesn't cost you $8,000, it costs you $3,760 — which is either a relief or a reason to act, but at least it's a number.
Cash breakeven vs accounting breakeven
There are three versions of this number and they're all legitimate. Confusing them is what starts arguments.
- EBITDA breakeven — $79,000. Covers operating costs. The number to run the outlet against day to day.
- Full breakeven — $89,400. Add depreciation ($4,000) and interest ($900) to fixed costs. This is the number that makes the outlet profitable on paper.
- Cash breakeven — $80,900. Add interest but not depreciation, because depreciation doesn't leave the bank. If you're servicing a fit-out loan, add the principal repayment too.
For a venue still inside its first couple of years, the gap between $79,000 and $89,400 is the whole conversation. It's trading fine and losing money, which is a normal and survivable condition — as long as everybody knows which of the three numbers they're talking about.
The number moves when your channel mix moves
This is the part that surprises operators, and it's the reason the breakeven calculation has to be monthly rather than a one-off exercise on a napkin.
Hold sales flat at $100,000 and shift the delivery mix from 38% to 50%. Nothing else changes — same menu, same rent, same roster, same commission rate:
| 38% delivery | 50% delivery | |
|---|---|---|
| Platform commission | 10,640 | 14,000 |
| Promotion spend | 1,000 | 1,300 |
| Card payment fees | 900 | 720 |
| Contribution margin ratio | 47.0% | 43.5% |
| Breakeven sales | $79,000 | $85,300 |
The contribution margin ratio drops 350 basis points and breakeven climbs $6,300 — on identical revenue, with nobody making a single decision. A shift in mix is a shift in your cost structure, and if you're only watching the top line you'll see a flat month and wonder why the bank balance moved.
It also means the honest version of "we're growing delivery" is "we're growing a lower-contribution channel," which might still be the right call — for kitchen utilisation, for reach, for the hours you'd otherwise be dark. It just isn't free, and the breakeven number is where the price shows up.
What operators actually do with it
Decide what to open. If Monday dinner reliably does $1,400 against a variable cost of 53%, it contributes $658 toward fixed costs. Unless the incremental staffing to open is more than that, closing costs you money.
Price the promotion. A 20% discount doesn't cut 20% of your profit, it cuts a chunk of your contribution margin — and at 47%, a 20% discount needs roughly a 74% volume lift to leave you no worse off. That number ends most promotion debates quickly.
Sanity-check a new lease. Rent is the largest single fixed cost most groups sign up for, and it's irreversible. Run the breakeven at the proposed rent, then ask whether the site can realistically do that volume in year one. It's a five-minute calculation against a five-year commitment.
Track "days to breakeven." Divide breakeven by your average daily sales. If the answer is 24, you spend twenty-four days of every month covering costs and six days making money — and you'll feel the month differently from day one.
Watch it per outlet, monthly. Breakeven isn't a constant. It moves with rent reviews, with headcount, with delivery mix, with commission renegotiations. A group with eight venues has eight breakeven numbers and they all drift.
That last one is where the spreadsheet version tends to die. Calculating it once for one venue is an afternoon; recalculating it every month for eight venues, off a fixed/variable split that has to stay consistent across all of them, is a job nobody has time for. When we build group P&L systems, the contribution margin ratio, fixed cost base and breakeven sit on every outlet tab and recalculate themselves each month from the same ledger data the P&L uses — so the number is current rather than remembered. If you've never had that number per outlet, it's worth a conversation.
The short version
- Breakeven sales = fixed costs ÷ contribution margin ratio
- Classify costs by how they behave, not by habit — watch turnover rent and hourly labour
- Know which of the three numbers you're quoting: EBITDA, cash, or full breakeven
- Every dollar either side of breakeven is worth your contribution margin, not its face value
- Delivery mix moves your breakeven even when sales don't
- Recalculate monthly, per outlet

Jarvin
Finance × Operations × Software. I build operations platforms for F&B businesses — for people who’d rather be running their business than building their tools.
Fig. 01 / BriefRev. A
Want to talk shop?
Tell us what’s slowing you down.