How to Build a Consolidated P&L for a Multi-Outlet Restaurant Group
10 min read
You run six outlets. Your bookkeeper sends six P&Ls. Someone in head office opens all six, copies the numbers into a master sheet, and by the third week of the month you have a group figure that everybody quotes and nobody fully trusts — because one outlet's rent is sitting in "Other expenses," another's delivery commission was netted off sales before it ever reached you, and the new site that opened in April is making the year-to-date column look like a collapse.
A consolidated P&L for a restaurant group is not six P&Ls added together. It's a single report that answers two questions at once: how is the group doing, and how is each outlet doing on the same terms as every other outlet. Most groups build the first and lose the second, which is how you end up with a profitable group containing two venues quietly bleeding.
Here's how to structure one that survives contact with a real operating business.
What a consolidated P&L has to do that a normal P&L doesn't
A single-venue P&L has one job: tell you whether the venue made money. A group report has four:
- Add up. Every entity rolls into one set of numbers, with no double-counting of inter-company charges.
- Stay comparable. The rent line means the same thing in every outlet, so a 12% rent ratio in one venue and 19% in another is a real difference, not a mapping accident.
- Preserve unit economics. Group EBITDA tells you nothing about which kitchen to fix. The outlet-level detail has to survive the consolidation.
- Handle change. Outlets open, close, and get added mid-year. The report has to absorb that without breaking last year's comparatives.
Design for all four from the start. Retrofitting the third one into a spreadsheet that was only ever built to add up is where most of the pain lives.
One tab per entity, one tab that adds them up
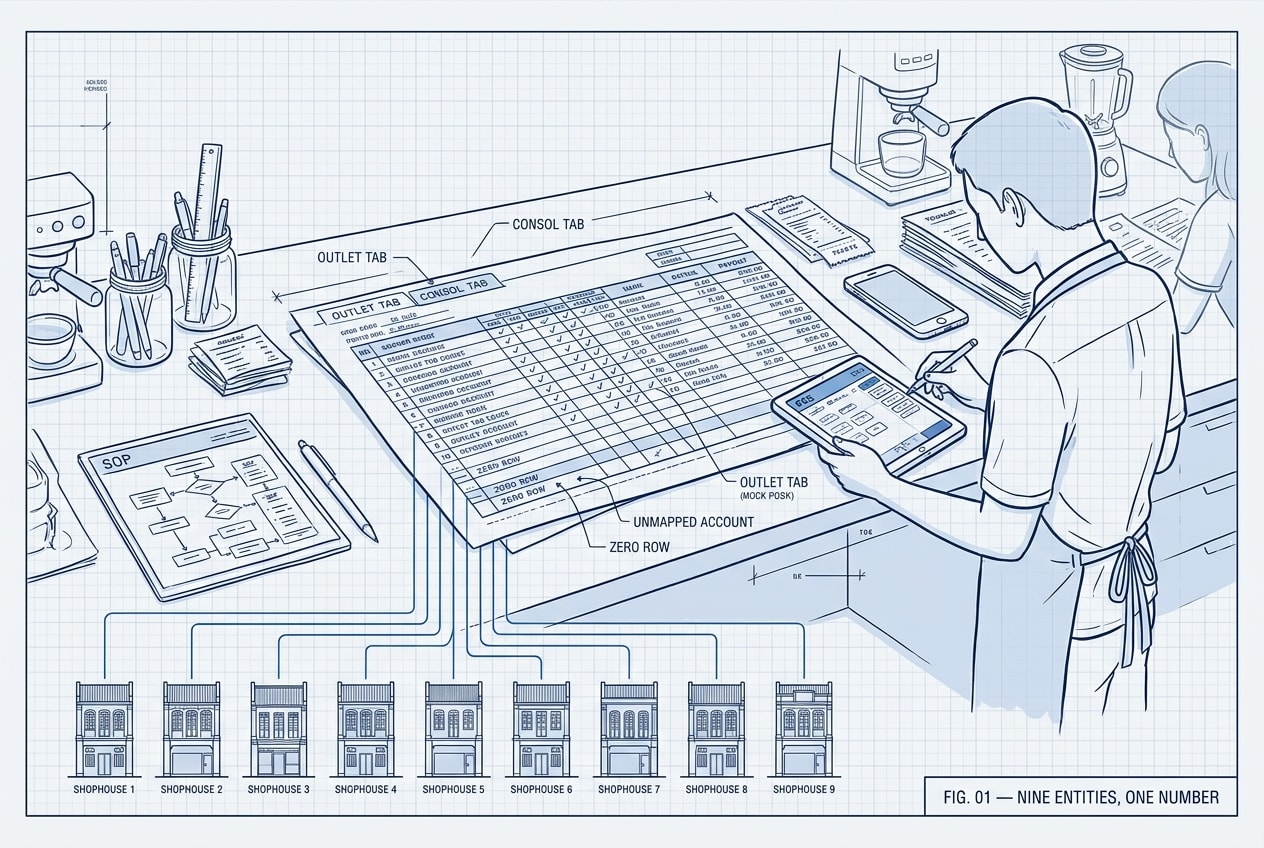
The structure that holds up at scale is boring and rigid on purpose: one tab per entity, built from an identical template, plus a consolidation tab that sums across them.
Identical is the operative word. Same rows, same order, same row numbers, every single entity. The moment one outlet's tab has an extra line inserted at row 34, your consolidation formulas are summing rent into staff costs and nobody finds out for a quarter.
That rigidity buys you two things. The consol tab becomes a simple sum rather than a lookup maze, and any outlet can be compared to any other outlet by reading across the same row. It also means adding a seventh venue is a matter of copying a tab, not redesigning a report.
Split sales the way the business actually sells
Most accounting systems give you one revenue line, or a handful that mirror the sales tax treatment rather than the operation. That's not how a restaurant group thinks about its own sales.
At minimum, split delivery and non-delivery. These are different businesses with different margins running out of the same kitchen, and if they're blended you can't see either one. A venue at 42% delivery mix and a venue at 8% will look like they have the same cost problem when they have completely different problems.
Beyond that, most groups need the revenue channels that actually exist in the business:
- Restaurant — walk-in, dine-in, the core trade
- Corporate orders (B2B) — bulk, invoiced, different pricing and different working capital
- Events — lumpy, high-margin, easy to over-celebrate in a good month
- Related-party sales — charges between your own entities, which must be visible so they can be eliminated on consolidation rather than inflating group revenue
The channel split doesn't have to be exhaustive. It has to match how the group makes decisions. If nobody has ever made a decision about events, don't build an events line.
Give delivery platform fees their own line
This is the structural choice that matters most, and it's the one most groups get wrong.
Delivery platforms take their commission before the money reaches you, so the temptation is to book the net payout as revenue and move on. Do that and the fee vanishes — you can't see it, benchmark it, or negotiate against it, and your food cost percentage is quietly calculated against a smaller denominator than your menu prices assume.
The alternative is to book gross sales and show the platform cost as its own line:
| Line | Month | % of sales |
|---|---|---|
| Sales — non-delivery | 62,000 | 62.0% |
| Sales — delivery | 38,000 | 38.0% |
| Total sales | 100,000 | 100.0% |
| Less: platform fees | (10,640) | 10.6% |
| Net sales | 89,360 | 89.4% |
| Cost of goods sold | (30,000) | 30.0% |
| Gross profit | 59,360 | 59.4% |
Gross profit is sales minus cost of goods sold minus platform cost. The 10,640 is 28% of delivery sales — and 10.6% of total sales. Both numbers are worth watching, and they answer different questions. The first tells you what the platforms cost you per delivery dollar. The second tells you what they cost the business overall, which moves every time your channel mix moves, even when the commission rate doesn't.
Promotion spend on the platforms deserves the same treatment: its own line, tracked as a percentage of delivery sales, so a month where the discounting got away from you shows up as a number rather than a feeling. Getting the raw data clean enough to do this is its own exercise — we covered that in reconciling delivery app payouts against your POS.
Group costs into operator buckets, not accounting ones
Your chart of accounts probably has ninety expense codes. An operator has five questions. Map the ninety into buckets that match the questions:
- Rental — base rent, turnover rent, service charge
- Payroll — salaried and hourly, kept separable
- Staff-related — meals, uniforms, training, transport, statutory contributions
- Marketing — brand spend, kept apart from delivery platform promotions
- Other operating — utilities, repairs, cleaning, consumables, card payment fees, subscriptions
From there the report runs straight down: EBITDA, then depreciation, EBIT, interest, and net profit. Keeping depreciation and interest below EBITDA matters more than it sounds — a group with three recently fitted-out venues carries depreciation that says nothing about whether those kitchens are trading well today.
The ratios are the actual product
The dollar figures get read once. The ratios get argued about, and they're what change behaviour. The set worth carrying on every outlet tab:
- Rent, manpower, utilities and repairs as a percentage of sales
- Back-office and head-office recharges
- Card payment (MDR) fees as a percentage of sales — small, constant, and invisible in most P&Ls
- Platform commission as a percentage of delivery sales and of total sales
- Promotion spend as a percentage of delivery sales
- Marketing as a percentage of restaurant sales, not total sales — you're not marketing to get delivery orders the platform already owns
One decision to make explicitly: are these ratios struck against total sales or net sales? Both are defensible. What isn't defensible is using total sales for rent and net sales for labour in the same report, or two outlets computing the same ratio differently. Pick one, write it down, apply it everywhere, and know that a delivery-heavy venue will look several hundred basis points better on net sales than on total.
Columns: the comparison is the report
A single month in isolation is almost useless. The column layout is what turns a statement into a management report:
- Each month, with its % of sales sitting immediately beside it
- Year to date, and quarters
- The same month last year, and the prior full year
- Variance — percentage change for dollar amounts, basis points for anything that's already a percentage
That last distinction is worth being pedantic about. A rent ratio moving from 12.0% to 13.5% is up 150 basis points, not up 12.5%. Report it as a percentage change and someone will eventually read it as a rent increase that never happened.
Mapping: where consolidations quietly break
Every consolidation is really a mapping exercise: which accounts roll into which line. The failure modes are consistent enough to design against.
Unmapped accounts. Somebody creates "Delivery Commission - Grab (new)" in the accounting system in March. It isn't in the mapping, so it falls out of the report entirely. The consol tab still balances. The number is just wrong. The report should refuse to stay silent about this: any account carrying a value with no mapping needs to raise a flag, loudly, on the face of the report.
Look-alike account names. "Staff Welfare" and "Staff welfare" and "Staff Welfare - F&B" are three accounts in the system and one line in an operator's head. Flag near-identical names so someone can merge them instead of splitting a cost across three rows.
Mapped accounts with no activity. If an outlet had no repairs this month, the repairs row should still print as zero. Drop the row and every downstream tab shifts by one line — and the consol tab sums the wrong things. Silence and zero are not the same thing, and a group report should never make them look alike.
Hard-coded logic. The account groupings and the ratio definitions will change — a new platform, a new cost category, a new way of splitting payroll. If those definitions live in code, every change is a ticket and a wait. If they live in a configuration sheet the finance lead controls, the report adapts the same week the business does. On both of the group reports we've built to this pattern, the client's own sheet drives the groupings, and it's the single thing that has saved the most time over the life of the project.
When a new outlet joins mid-year
Outlets open. A group of eight becomes nine in December and ten in April, and every comparative column has to cope.
The rules that keep it honest: a new entity shows only from the month it starts trading, with no prior-year comparative invented for it. Year-to-date group figures should be readable both ways — as reported, and like-for-like on the outlets that existed last year. Otherwise a 9% group revenue increase might be one new venue masking a decline across everything that was already open, and you'd never know.
Where the spreadsheet version stops working
One outlet in a spreadsheet is fine. Three is manageable. Somewhere around six, three things happen at once: the file gets slow enough that people stop opening it, the mapping lives in one person's head, and the monthly rebuild takes long enough that the report lands after the decisions have already been made.
The breaking point isn't complexity — it's latency. A group P&L that arrives on day 21 is a history lesson. The same report on day 5 is a management tool, and the difference is almost entirely about whether the assembly is automated or manual.
That's the point where we usually get the call. Hippo Labs builds these as report-generating systems: the accounting data flows in, the client's own configuration sheet decides the groupings and ratios, and the group P&L rebuilds itself with every outlet tab and a consol tab, in the same layout, every month. On the accounting integration side we work with Cheetah to pull the ledger data straight out of Xero so nothing is re-keyed. If your month-end is nine tabs and a prayer, that's worth a conversation.
The short version
- One tab per entity, identical template, one consol tab that sums them
- Split sales by channel — delivery vs non-delivery first, then the channels that drive decisions
- Show platform fees as their own line, not netted into revenue
- Group costs into operator buckets, run down to EBITDA, then net profit
- Carry the ratios on every tab, and be consistent about net vs total sales
- Comparatives are the report: % of sales, YTD, prior year, and basis points for margin moves
- Flag unmapped accounts loudly, and keep zero rows in
- Let the mapping live in a config sheet, not in code

Jarvin
Finance × Operations × Software. I build operations platforms for F&B businesses — for people who’d rather be running their business than building their tools.
Fig. 01 / BriefRev. A
Want to talk shop?
Tell us what’s slowing you down.