Food Cost Variance: Why Your Kitchen's Numbers Never Match (And How to Close the Gap)
8 min read
Your recipe says a plate of nasi goreng costs $2.40 to make. You priced it, you costed it, you know the number. Then month-end closes and your food cost is sitting at 34% when the menu math said 28%. Six points. On a venue doing $80,000 a month in food sales, that's nearly $5,000 a month evaporating somewhere between the receiving door and the pass.
That gap has a name. It's called food cost variance, and it's one of the most expensive numbers in F&B that almost nobody watches closely.
What food cost variance actually is
There are two food cost numbers in every kitchen, and they're rarely the same.
The first is your theoretical food cost — what your dishes should cost if everything went perfectly. Every portion exact, every gram accounted for, zero waste, zero spoilage, zero giveaways, zero theft. It's built bottom-up from your recipes and current ingredient prices.
The second is your actual food cost — what your dishes actually cost, calculated top-down from real numbers: opening inventory, plus everything you purchased, minus closing inventory, divided by sales. This is the number your accountant sees. It's the truth.
Food cost variance is the gap between them.
Theoretical says 28%. Actual says 34%. The 6-point variance is the money you can't explain — and almost all of it is money you're losing.
In a tight operation, that gap is 1% or less. In most F&B businesses we see, it's quietly running at 3-6% and nobody has put a number on it, because the two figures live in two different places: theoretical lives in a chef's head or a recipe spreadsheet, actual lives in the monthly P&L your bookkeeper produces three weeks after the month ends.
Where the variance hides
The variance isn't one leak. It's a dozen small ones, and they each tell you something different about your operation. Some are easy to shut off once you see them; others are baked into how a kitchen runs and take real work to move. Start with the ones you can fix this week.
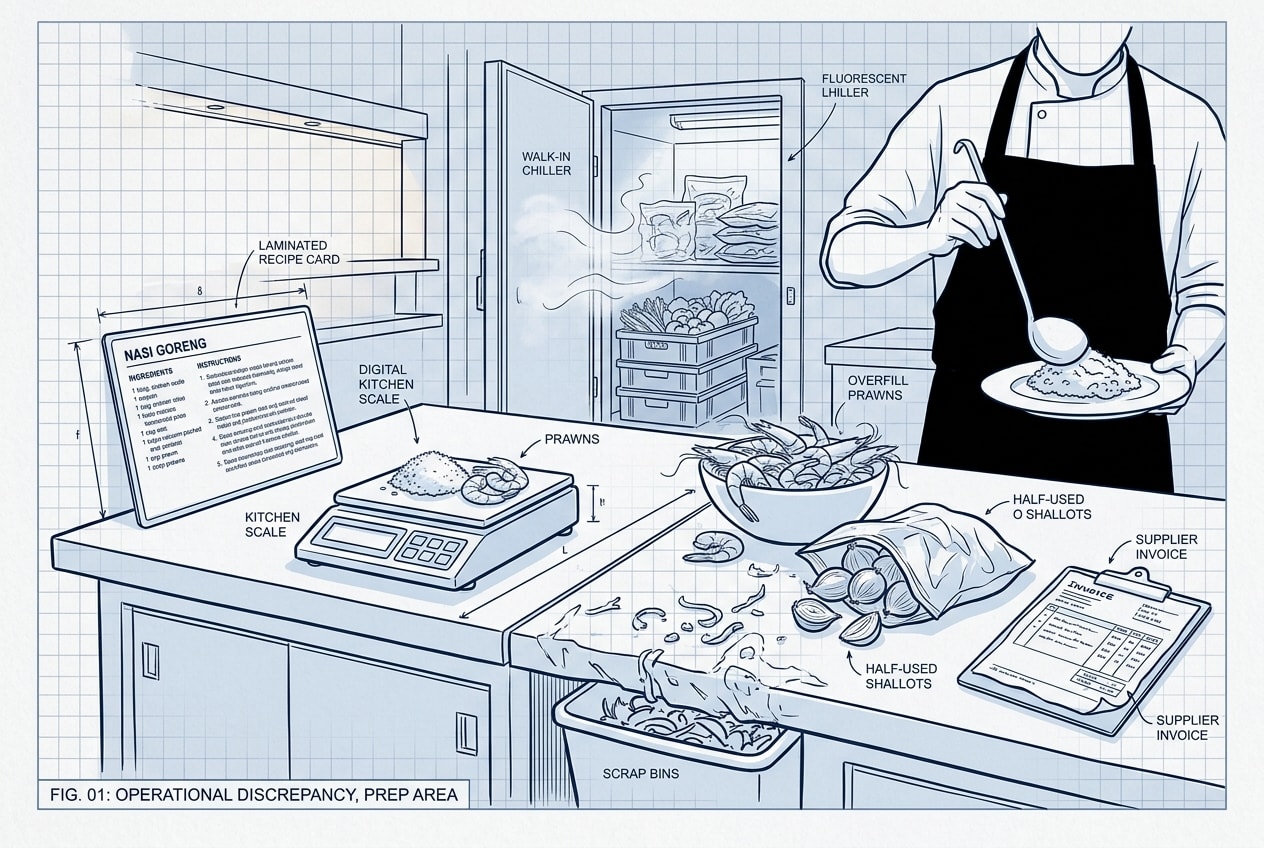
Receiving errors. You were invoiced for 20kg of prawns. You received 18kg. Nobody weighed it at the door. You paid for 20, you can sell 18, and the 2kg gap shows up as variance you'll blame on the kitchen. This is the most fixable leak on the list — a scale at the receiving door and a signature on the delivery docket closes most of it.
Comps, staff meals, and giveaways. The free dessert the manager sent to table 12. The staff meal that came off the same inventory but never rang through the POS. Each one is small. Together, across a month, they're a line item — and they're controllable the moment you make staff ring them through, even at zero price, so the inventory is accounted for.
Waste and spoilage. Trim you didn't account for, prep that didn't sell, produce that turned before you used it. This is the single biggest contributor in most kitchens, and the one operators most often dismiss as "just part of the business." Tighter par levels, a waste log, and disciplined prep-to-forecast bring it down — it takes habit, not heroics.
Theft. Nobody likes to say it, but inventory walks. Variance is often the first and only place it shows up. You can design a lot of it out with access controls and tight counts, but you'll never fully eliminate it — so it sits in the middle of the list.
Over-portioning. The recipe calls for 150g of protein. The line cook, slammed on a Friday night, eyeballs it at 180g. Do that across a few hundred covers and your most expensive ingredient is quietly costing you 20% more than it should. Scales and portion tools help, but on a packed service, consistency is genuinely hard to enforce — this one fights you.
Yield loss. Your recipe assumes a whole fish yields 60% usable fillet. Your actual yield is 52%. That 8% difference isn't in any recipe card — it's in your variance. Some of it is butchery skill you can train, but a lot is the product itself: the size of the fish, the season, the supplier. It's the least controllable leak on the list, which is exactly why your recipe yields need to reflect reality rather than the ideal.
The point isn't to catch a culprit. The point is that variance is a diagnostic. A 6% gap doesn't tell you which of these is happening — but it tells you the money is leaving, and a properly tracked variance, broken down by category or even by dish, tells you where to look first.
Why most F&B operators never see it
The maths isn't hard. The problem is that the two numbers you need to compare are produced by two completely different systems that don't talk to each other.
Your theoretical cost needs current recipes, current ingredient prices, and accurate sales mix from your POS — how many of each dish you actually sold. Your actual cost needs a real stocktake at the start and end of the period, every supplier invoice, and a clean sales total.
Stitch those together by hand and you're looking at a half-day of spreadsheet work every single month, per outlet. So it doesn't happen. Operators check their actual food cost percentage on the P&L, see it's "around 33%, like always," and move on. The variance stays invisible because nobody's calculating the theoretical number to compare it against.
This gets exponentially worse the moment you run more than one venue. Three outlets means three stocktakes, three sets of invoices, three sales mixes — and a head office that wants one comparable number across all of them. Most multi-outlet groups we work with are reconciling this in a master spreadsheet that one person understands and everyone else is afraid to touch. It's the same structural problem we wrote about in reconciling delivery app sales with your POS payouts: two sources of truth, a gap between them, and no system built to close it.
How to actually close the gap
You don't fix variance by staring at the monthly P&L harder. You fix it by making the comparison routine, granular, and fast enough to act on.
Count consistently. Variance is only as accurate as your stocktake. Same items, same units, same day of the week, same person where possible. An inconsistent count produces a fake variance that sends you chasing ghosts. This is exactly the kind of thing a tight F&B SOP is for — a stocktake everyone does the same way every time.
Cost your recipes properly, and keep them current. Your theoretical number is worthless if it's built on last year's prices. When prawns go up 15%, your recipe cost needs to move with it — otherwise you'll read the resulting variance as waste when it's actually inflation.
Shorten the period. A monthly variance tells you something went wrong three weeks ago. A weekly variance on your highest-volume dishes tells you something is going wrong now, while the prep cook who's over-portioning is still on shift. The faster the loop, the cheaper the lesson.
Drill into the worst offenders first. You don't need to variance-check 120 menu items. Find the 10 dishes that drive most of your food cost and watch those. That's where the money is, and that's where a 2% improvement actually moves the P&L.
Connect the systems. The real unlock is getting POS sales mix, recipe costs, purchasing, and inventory into one place so the variance calculates itself. When that pipeline exists, the half-day spreadsheet job becomes a number you check with your morning coffee.
On one multi-outlet project, we built the actual-cost side entirely bottom-up — not from a manual stocktake estimate, but from the real outgoing supplier payments sitting in the client's accounting system. The money that actually left the bank for ingredients, matched against what was sold. We worked with Cheetah as our tech partner on the Xero integration, pulling purchasing and payment data straight out of the accounts so it flowed into the variance calculation automatically instead of being re-keyed by hand. The result was a ingredient cost number the operator could actually trust, because it was reconciled against money that had genuinely moved — not a figure assembled from three spreadsheets and a hopeful guess at closing stock.
The number worth building around
Food cost variance is the difference between knowing your overall food cost is "around a third" and knowing that your seafood dishes are running an 8-point variance while everything else sits near 1% — that the leak is concentrated in six menu items, on weekend services, and you can do something about it on Monday instead of finding out at quarter-end.
For a single venue, a disciplined spreadsheet and a consistent stocktake will get you most of the way there. The trouble starts when you're running several outlets, each with its own kitchen, its own suppliers, and its own way of counting, and head office needs one trustworthy number to compare them by. That's the point where the manual approach quietly breaks and the variance disappears back into the noise.
That's the gap Hippo Labs builds for. We build custom ops platforms that pull POS, recipes, purchasing, and inventory into one place, so food cost variance is a live number per dish and per venue — not a quarterly archaeology project. If your food cost feels like it's always "around a third" and you've never been able to say exactly why, that's worth a conversation.

Jarvin
Finance × Operations × Software. I build operations platforms for F&B businesses — for people who’d rather be running their business than building their tools.
Fig. 01 / BriefRev. A
Want to talk shop?
Tell us what’s slowing you down.